White Papers
The Evolution of Pathogen Testing for Environmental Monitoring Programs
Potentially pathogenic microorganisms, like Listeria spp., have well-established histories of contaminating food-sampling environments. That’s why food safety programs have matured to include monitoring of environmental hygiene in food manufacturing facilities.
At one point, genus-level screening was enough for environmental monitoring programs. But as food safety programs have evolved under increasing regulatory and consumer pressure, genus-level screening no longer suffices. Now, food manufacturers need to quickly and accurately identify the source and nature of microbial contamination. To do so, they need to be able to distinguish between the various species and subspecies of a pathogen so that they can monitor and eliminate the pathogen from their facilities.
Over the years, scientists have developed several methods to compare the DNA signatures of microorganisms. For food safety professionals, pulsed-field gel electrophoresis (PFGE), ribotyping, Similarity Analysis through targeted sequencing, and whole-genome sequencing (WGS) are the primary methods that have been used. Each of these methods aims to distinguish between one type of pathogen and another, but the methods’ effectiveness varies. Below, we’ll compare and contrast the four methods, starting with PFGE, the oldest technology.
Want to jump to a section? Use these links:
PFGE

PFGE is a DNA-based fingerprinting method that is used for subtyping microorganisms. The result looks like patterns of shorter and longer bands representing DNA strands of varying lengths. To interpret those patterns, scientists rely on software. Here’s how the protocol works.
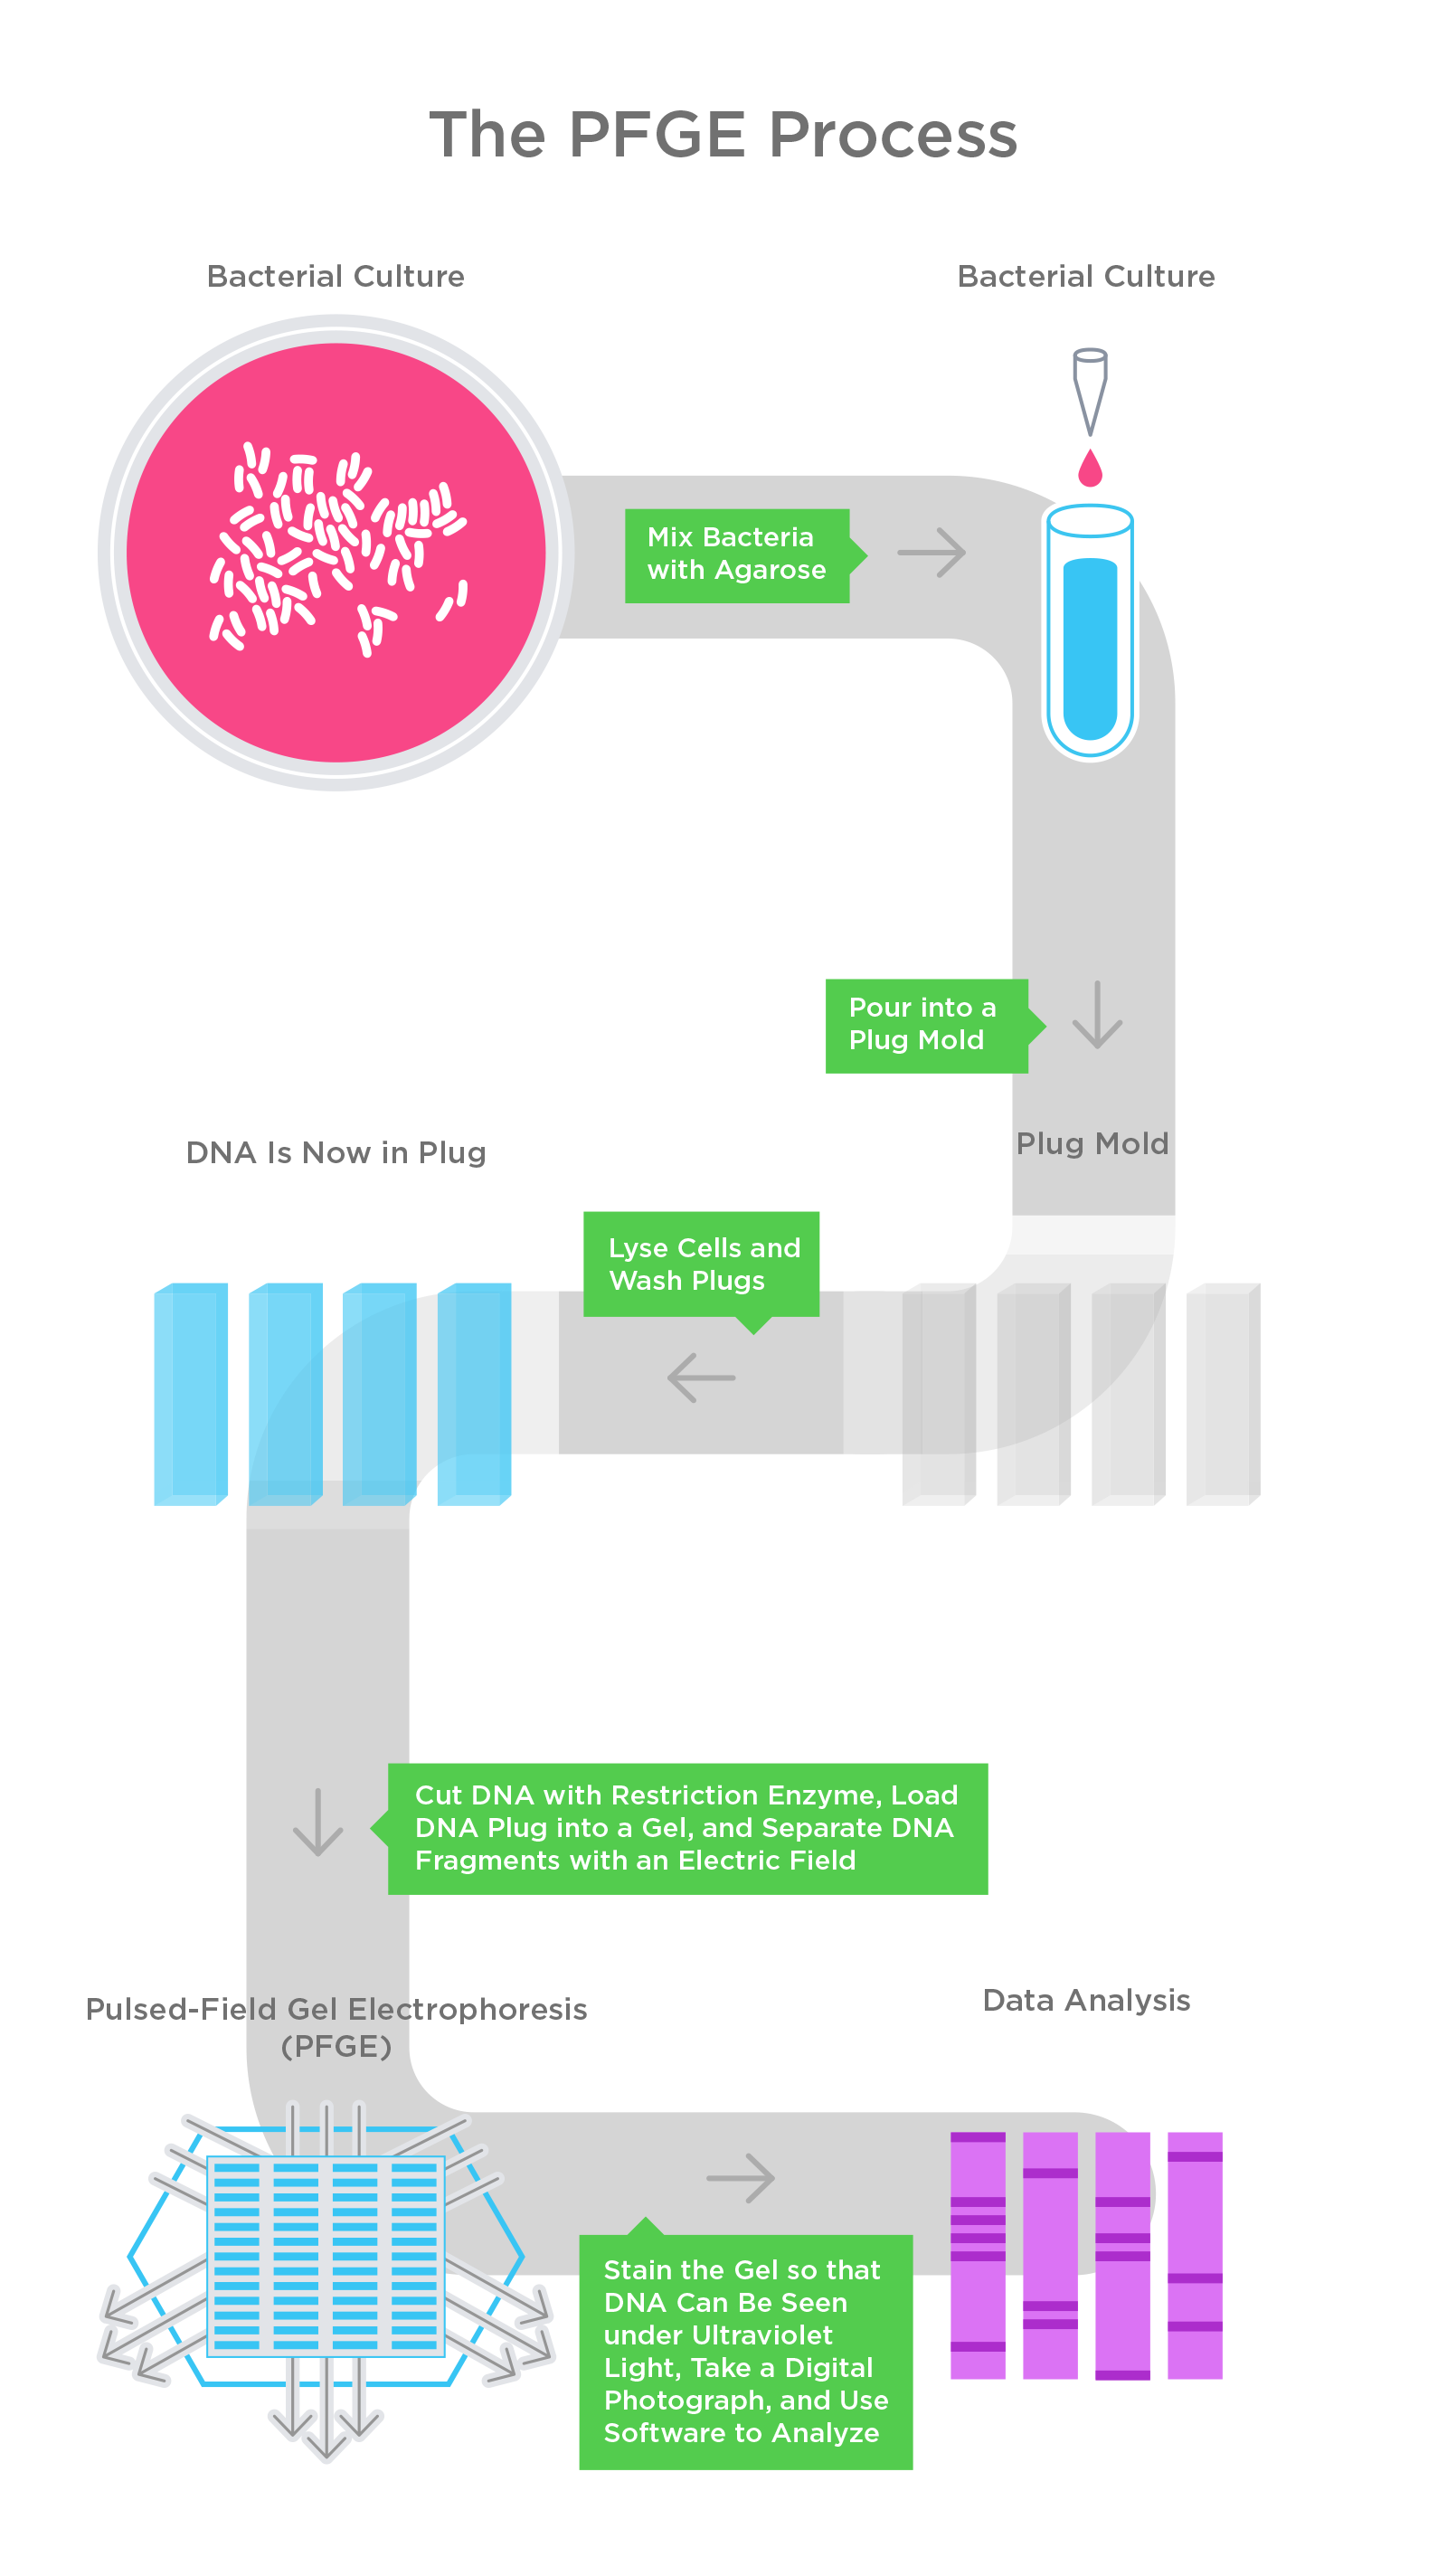
First, scientists take a pure culture of bacterial cells isolated on an agar plate and mix them with melted agarose. They then pour the substance into plug molds, and through a series of chemical reactions, the bacterial cells are broken down, and their DNA is fragmented.
Next, the scientists load the DNA-containing plug into a gel and apply an electric field. Since DNA is charged, an electric current draws the DNA fragments through the gel; the shorter fragments move quickly through the pores of the gel, while the long fragments move more slowly.
Finally, scientists stain the gel so that the DNA fragments can be seen under ultraviolet light. A digital camera takes a photo of the pattern in the gel, and the image is then stored on a computer. Those images can then be compared to other PFGE band patterns to see if there are any matches.
While PFGE was once considered the “gold standard” by the CDC, the method has its flaws. First and foremost, achieving optimal resolution is difficult. Bands of similar lengths tend to co-migrate and run together, making it difficult to interpret. To remedy this problem, scientists can use longer gels, but in turn, this may cause shorter bands of DNA to disappear. What is more, even if two-dimensional PFGE were employed, the resolution is still subpar to the data that next-generation sequencing generates.
Ribotyping

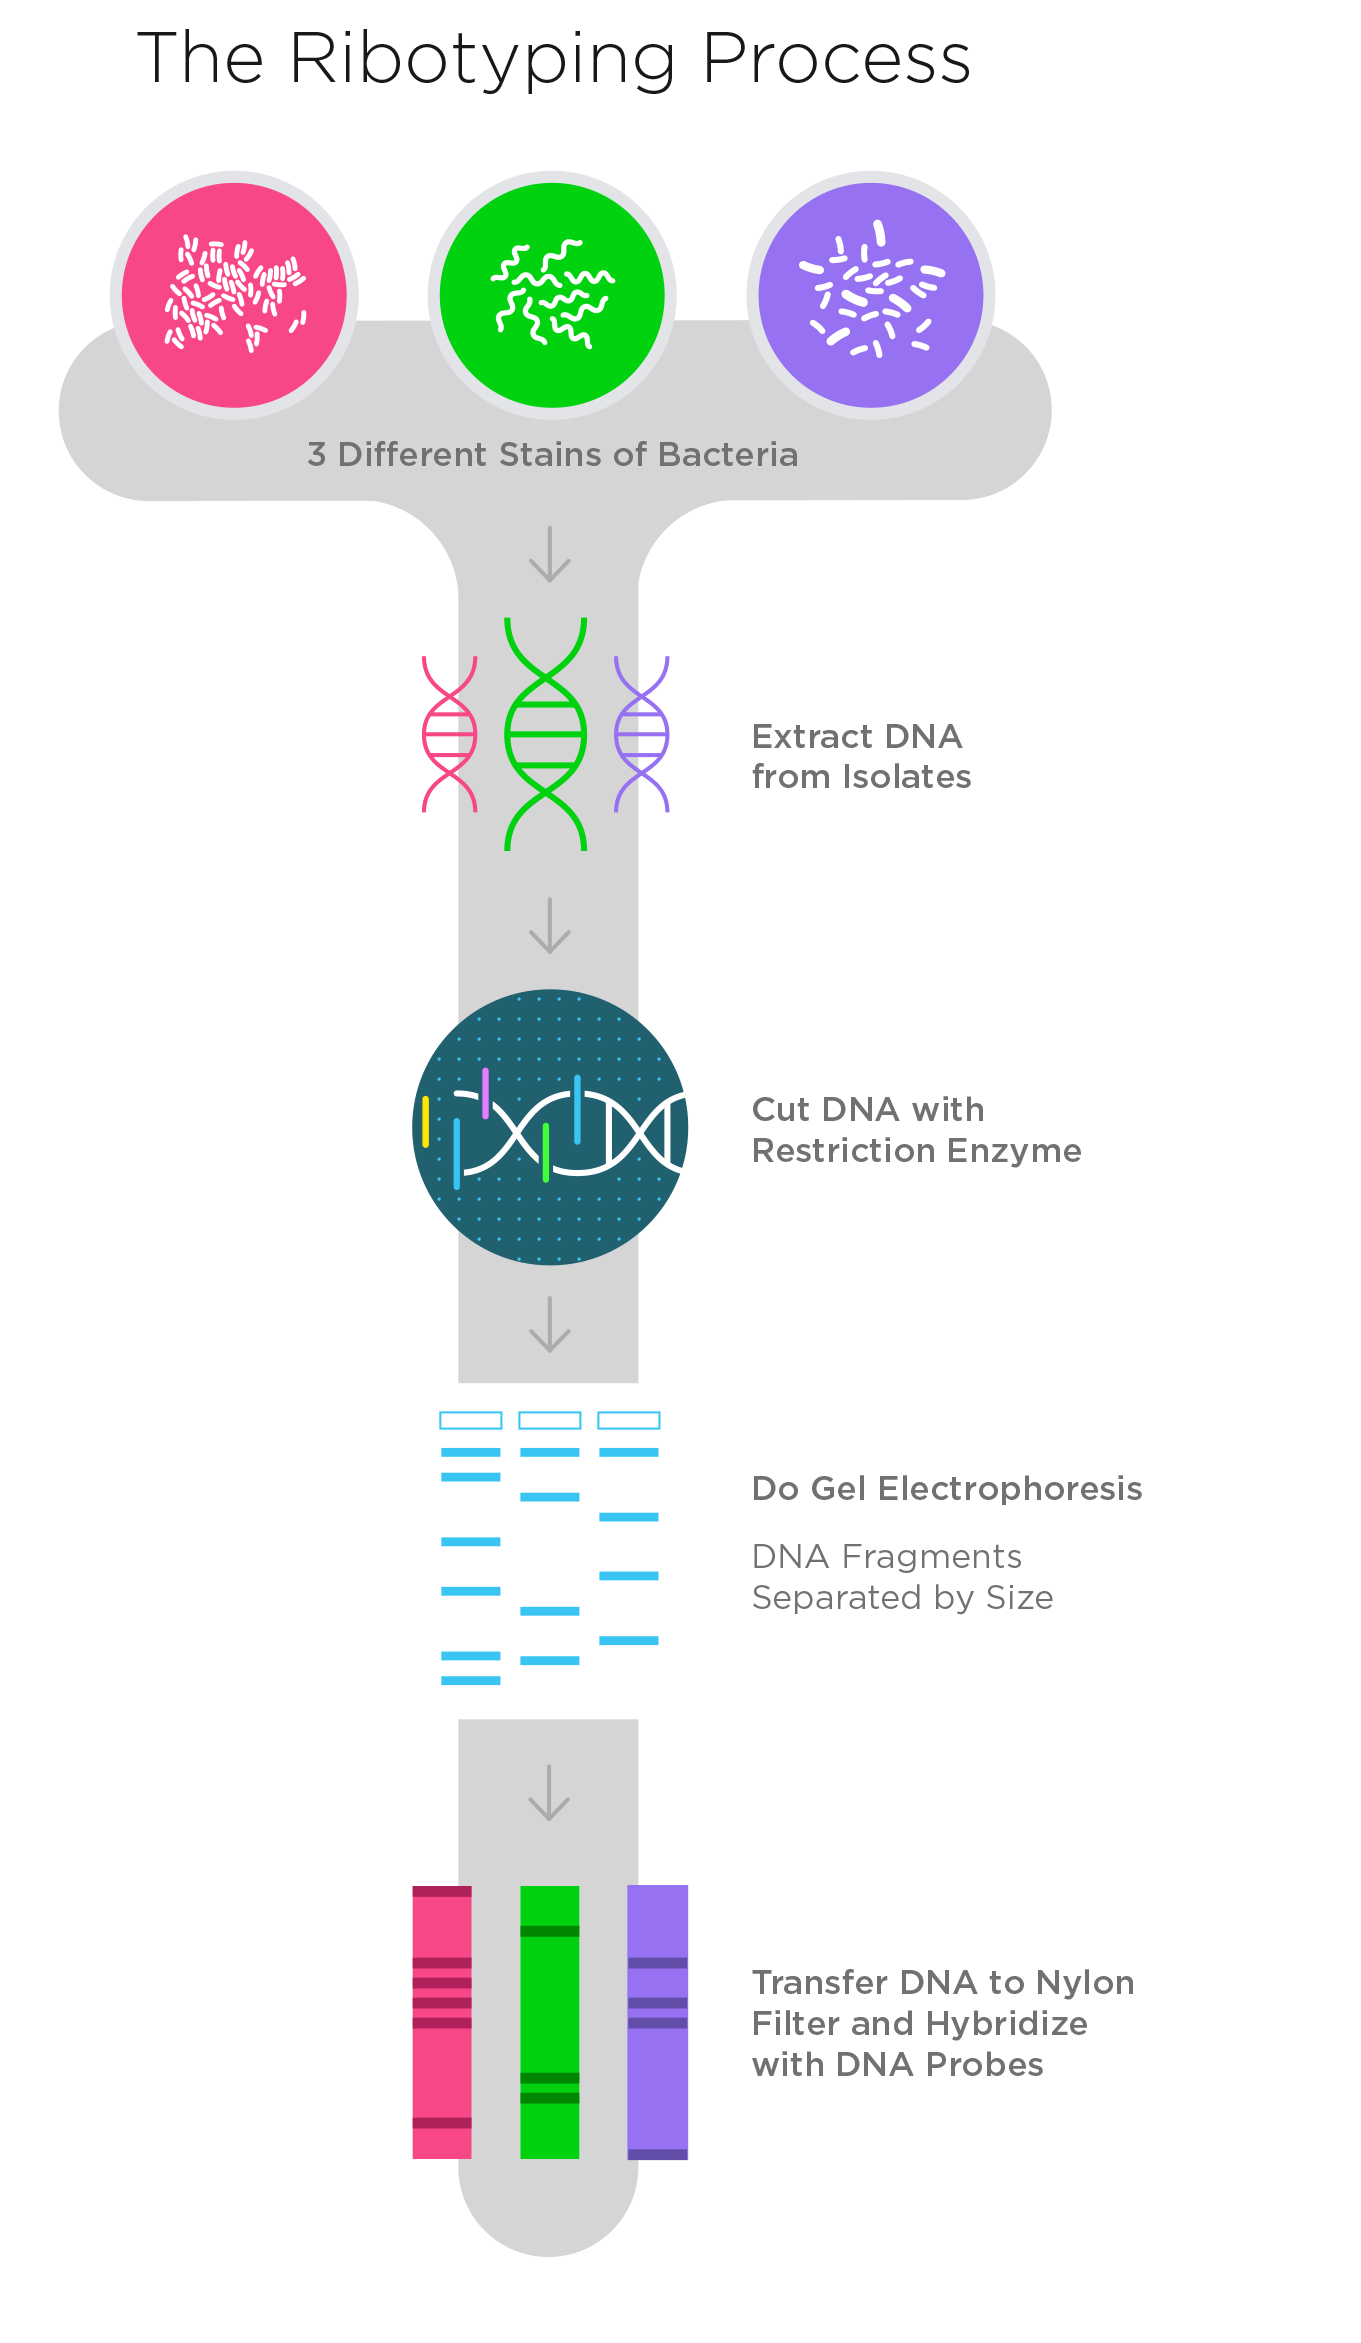
Like PFGE, ribotyping also produces a pattern of DNA fragments, but the technique is different. As we saw with PFGE, ribotyping starts with DNA extracted from isolates. A restriction enzyme then cuts the DNA at specific locations, generating fragments of DNA of varying lengths.
For those unfamiliar with ribotyping, here’s how it works. A restriction enzyme can attach to specific sequences of DNA. When it comes into contact with a DNA sequence that matches a particular sequence of nucleotides, called the recognition site, it wraps around the DNA and causes a break in both strands of the DNA molecule. Because different types of bacteria have different DNA sequences, the restriction enzymes will attach themselves in different places, and as a result, different strains or subtypes of a bacteria generate different patterns of DNA fragment sizes.
Listeria, for example, can have as many as 3 million base pairs. There would be too many pieces of DNA to look at the entire genome. As a result, ribotyping tools typically compare the pieces of DNA from the 5s, 16s, and 23s ribosomal RNA (rRNA) genes. rRNA genes are the least variable DNA in all cells. In fact, portions of the rRNA sequences from distantly related organisms are remarkably similar, yet their subtle differences can be exploited for this particular purpose.
Once the genome is cut, the sample is run on an agarose gel to separate the pieces. To visualize only the 5s, 16s, and 23s rRNA genes, scientists add a probe (i.e. a fragment of DNA or RNA) that attaches only to those genes. The end result is a series of bands of varying sizes, which are indicative of different subtypes of bacteria.
While many food companies have adopted ribotyping for their environmental monitoring programs and as a pathogen identification system, this method has its limitations. First, the turnaround time is slow because labs must isolate a pure colony before utilizing this method. Second, ribotyping is not a simple process. The traditional workflow is highly laborious and time-consuming, and even the commercially available automated methods are expensive, have limited throughput, and require significant support.
Finally, when subtyping a microorganism, more coverage of the genome is often better. Coverage refers to the percentage of the genome that is read. Ribotyping looks at three regions of the genome, which is an improvement over single-target methods. But what if we looked at more regions of the genome? Analyzing more regions of the genome means that we have more information about the genome, and more information means that we can identify and characterize a microorganism more accurately.
That’s where next-generation sequencing (NGS) comes in.
WGS
WGS is a common application of next-generation sequencing. Like ribotyping, WGS requires an isolate, which is then fragmented into smaller pieces so that the sequencer can read them. The sequencer then reads the order of the nucleotides (the basic building blocks of DNA, which are typically represented as an A, T, G or C). Because the entire genome is read, it is the most accurate way to look for mutations and other genotype anomalies and to determine a pathogen’s exact origin, strain, and potential for causing severe illness.
That said, WGS is mainly an investigative tool, and it is not the right approach for environmental monitoring programs that require routine pathogen testing. WGS is far too expensive for any type of daily or weekly testing. Even the most efficient labs spend hundreds of dollars per sample to perform WGS. These labs also need to be staffed by highly trained professionals, as WGS requires special expertise to prepare sequencing libraries and perform analysis. These procedures can only be automated on a small scale, making the overall process demanding and costly.
Additionally, WGS takes time. Haemophilus influenzae Rd., the first bacteria to be sequenced, took a year to sequence. Since the 1990s, the speed of WGS has improved greatly. Nevertheless, this method is still too slow for most food manufacturers. This is because the technology requires a clonal isolate to collect the necessary data, which takes time and intensive microbiological work to generate, on top of the time required for sequencing and analysis. Environmental monitoring programs need results quickly. Manufacturers cannot wait several days to a week for results.
Similarity Analysis through Targeted DNA Sequencing
As we discussed, it is currently prohibitively expensive and time-consuming to read the entire DNA sequence of every organism in your lab. Instead, similarity analysis through targeted sequencing examines the nucleotides at several specific locations of the genome. In other words, this method samples only the important parts of the genome necessary for the purposes at hand: distinguishing pathogens from a plethora of potential species and strains. Plus, unlike PFGE, ribotyping, and WGS, Similarity Analysis does not require isolation and can be done at the same time as screening.
Geneticists choose specific locations because those regions tend to have variants that distinguish one subspecies of a pathogen from another. The number of regions will vary based on the assay. Generally speaking, it looks at more regions than ribotyping, but it won’t read the entire genome as WGS does. (To see how Similarity Analysis performs compared to automated ribotyping, please contact us.)
So, let’s use an overly simplified example. Imagine that we have two samples that are positive for Listeria. In Sample A, we sequence one specific region, which reads “AGTCATCGA.” In Sample B, we sequence that same specific region, but it reads “AGTCTTACA.” As you can see, Sample A and Sample B do not match. So, they would be considered different subtypes of Listeria (Of course, an NGS platform will look at many more nucleotides across many more regions).
As food safety labs run samples, they begin to build a database of subtypes found in their facilities. Every time the lab runs an environmental monitoring test for Listeria, their food safety platform will compare the subtypes of new samples to those of previous samples. If there’s a match, QA teams will be able to look at a facility map and see when and where the matching samples were collected. That way, they can trace the flow of a particular subtype of Listeria through their facility and quickly determine the best corrective action.
By using similarity analysis, food safety professionals are able to:
- Reduce costs: Compared to WGS, which is prohibitively expensive, similarity analysis is in line with the costs of legacy technologies.
- Improve turnaround time: While legacy technologies take several days to produce results due to their dependence on isolates, similarity analysis can compare subspecies of a pathogen within roughly 24 to 36 hours, depending on the pathogen and matrix.
- Generate new insights: Because similarity analysis is seamlessly connected to environmental mapping software, food safety professionals can easily see historical trends and track the flow of a pathogen through a facility.
To learn more about nanopore sequencing, which is one type of NGS platform, watch this short video or consult this tutorial: What Is NGS? How Does It Work? And Why Does It Matter for Food Safety?
A Comparison

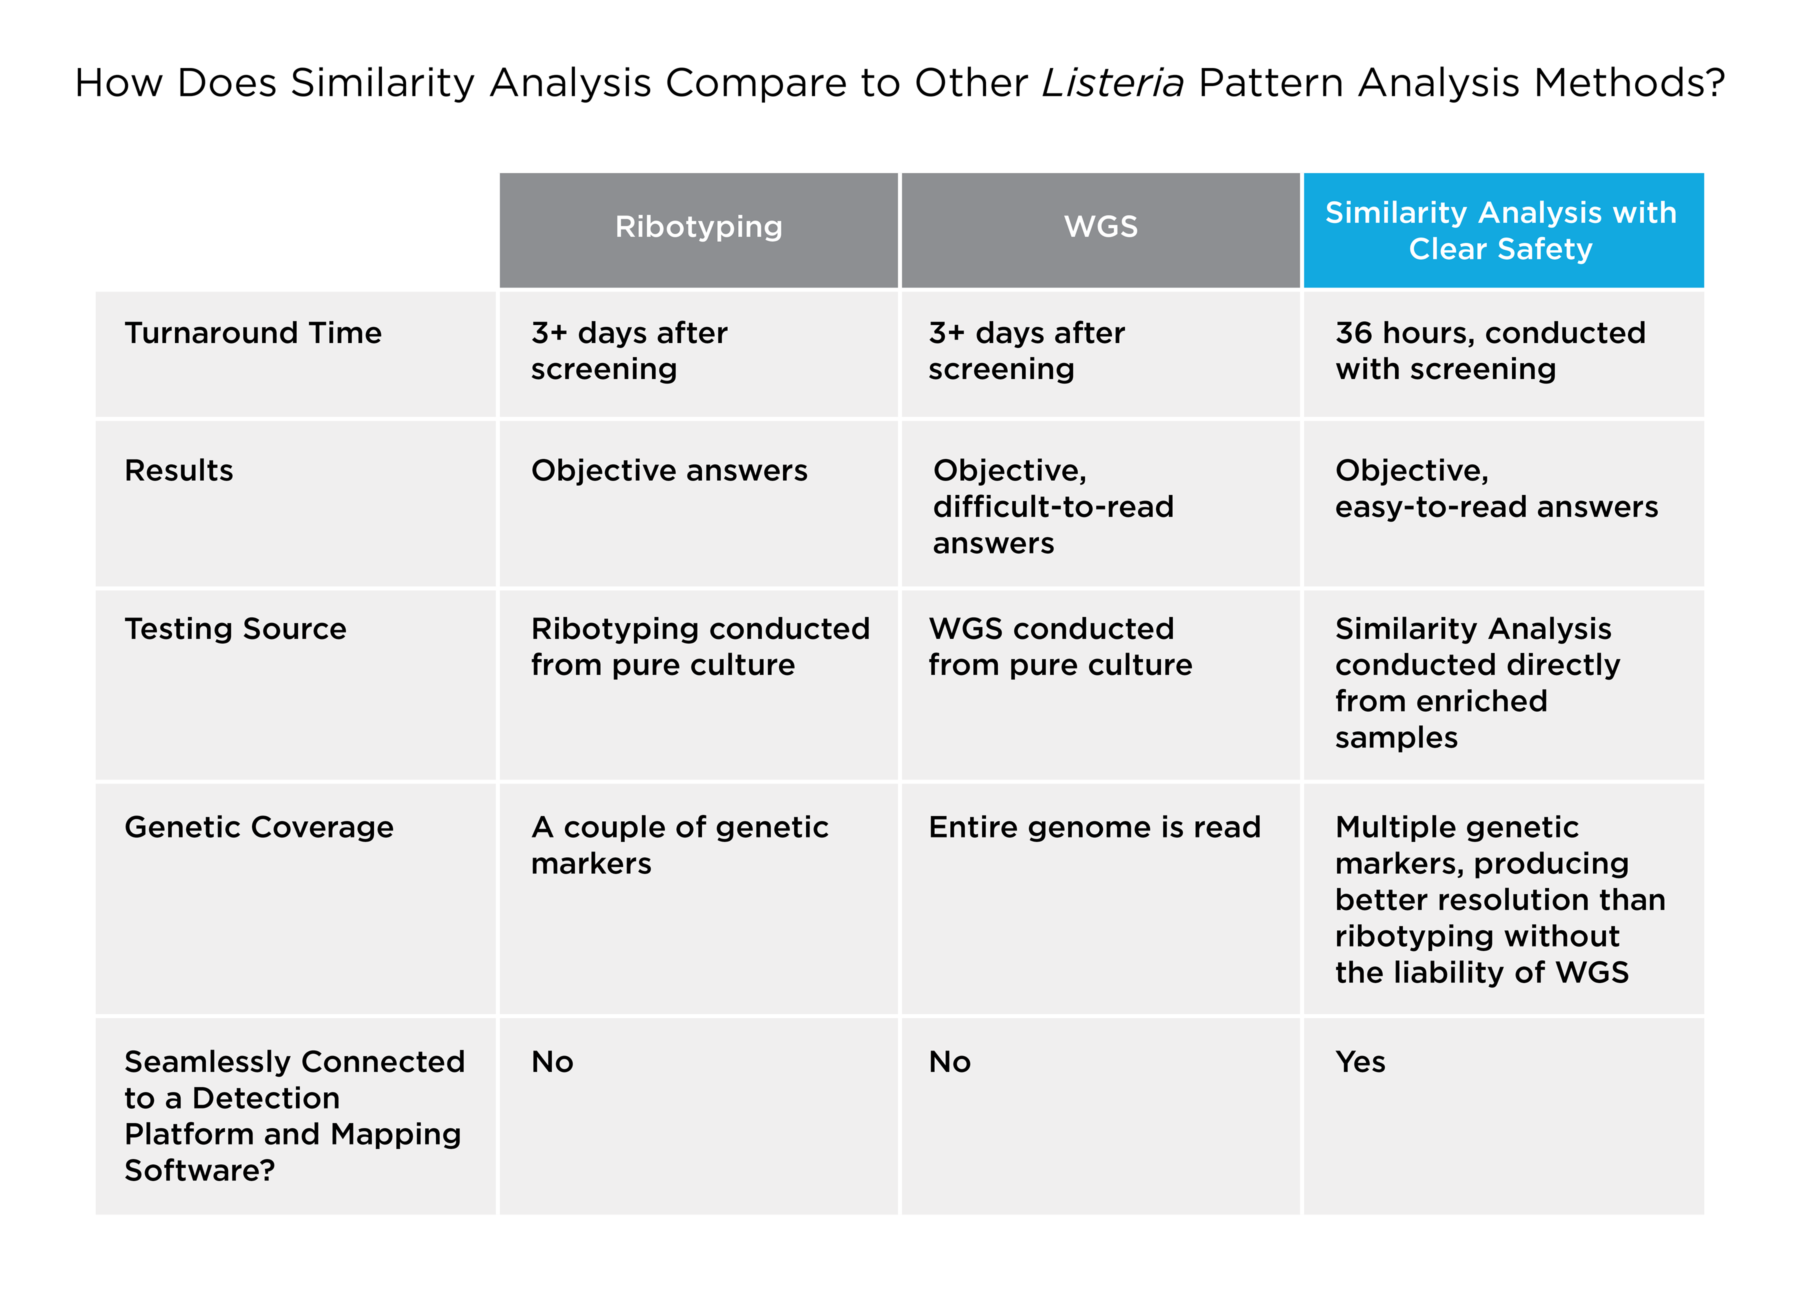
To recap, here’s a quick chart that summarizes the differences between ribotyping, WGS, and Similarity Analysis through targeted sequencing.
To learn more about how Similarity Analysis can benefit your environmental monitoring program, contact us.