Food Safety
Using Mapping Software to Streamline Environmental Monitoring Programs
The Imperative for Environmental Monitoring
It’s critical to monitor the hygienic environment in food manufacturing facilities. Microorganisms can enter food processing environments through raw materials, pests, water, employees, and many other pathways. While using routine sanitation practices can control many of them, pathogenic microorganisms like Listeria monocytogenes and Salmonella spp. can persist and contaminate food-handling environments, creating nagging problems.
That’s where an environmental monitoring program (EMP) comes into the picture. By combining visual inspection with microbiological testing, such programs assess the efficacy of the cleaning and sanitation practices in a facility, provide insights on the migration of pathogens, and help prevent possible contamination of food products.
The Case for Mapping Software
Let’s say that your QA team has identified environmental sampling sites throughout your plant. They gather samples that the microbiology lab tests, and your QA team receives the results thereafter. Now what?
When looking at the raw test results, it’s hard to imagine where the positives and negatives are located in the plant and connect the dots between contamination incidents. That’s where mapping tools come into play.
By creating a visual representation of testing results, you can get a big-picture perspective of a plant’s overall hygiene. For starters, maps of all sampling locations on a facility floor plan help identify hot spots for targeted cleaning and sanitation. Additionally, they show how specific subtypes of a pathogen are moving through a facility.

Unfortunately, many companies are trying to monitor and visualize their environments using manual tactics: logs in spreadsheets, printed maps, hand-drawn maps in PowerPoint, you get the picture. This makes persistence monitoring challenging and time-consuming at best–and ineffective at worst.
The good news is that there’s an easier way to map your contamination incidents–with mapping software that is designed for the food safety environment. Here are the top four benefits of incorporating environmental monitoring software.
1. Better QA Utilization
How long does it take for your team to manually input and plot test results? What would your team be able to do if they had that time back?
When companies employ mapping software, they improve their efficiency. No longer do QA teams need to put test results into a spreadsheet and then take a printed floor plan and draw the results by hand. Rather, a good mapping software tool will seamlessly integrate with your testing platforms by automatically importing detection and subtyping data. From there, it will display your test results on a map of your facility, allowing you to see where and when you have contamination incidents over time. In the end, QA teams save time so that they can do more, faster.
2. Automated Data Analysis
Let’s imagine that you run a robust environmental sampling program for Listeria. Your plant may collect 10 to 15 samples per week per line. Each test result includes metadata such as sample locations, days, and times, adding up to thousands of samples per year.
How is your QA team going to make sense of all that data? With that volume of testing, managing spreadsheets and hand-drawn maps is virtually impossible. Without sophisticated data analytics, it is nearly impossible to identify trends in the data.
With mapping software that is backed by data analytics, it is easy to spot trends over time. For example, QA specialists can easily visualize:
- Current and past hot spots
- The effectiveness of their corrective actions
- Which subtypes of a pathogen have appeared in a facility previously
- Whether that subtype has migrated through a facility
3. Real-Time Insights into Contamination Incidents
If you rely on spreadsheets and hand-drawn floor plans, you often find yourself several days–if not weeks–behind your contamination incidents. By using mapping software that connects seamlessly to your detection and subtyping platform, you can cut the turnaround time significantly because you can display your results on a floor plan as soon as your testing results are ready.
As a QA professional, imagine having instant access to continuously updated maps and floor plans of a plant. Using these visuals, quality professionals can actually see and collect big-picture data related to the movement of pathogens.
For example, with mapping software, you can see a strain of, say, Listeria migrate through the receiving area. And because you have almost real-time data, you can use corrective actions to stop the strain of Listeria in its tracks before it reaches the processing area, drastically reducing the number of future positives and amount of time spent dealing with those positive results.

4. More Awareness for Frontline Staff
Collecting environmental swabs regularly from the same locations and keeping records over time allows managers to identify trends. Presenting such analyses to sanitation teams helps them achieve and maintain better cleaning results. For example, you can highlight which drains need more attention, or you can praise your team for quickly handling a contamination incident.
Communication with sanitation teams is critical for a successful EMP, and showing the data in a spreadsheet won’t resonate with most employees because it will look like a bunch of results and spatial coordinates and time stamps that aren’t connected in the viewer’s mind.
On the other hand, your frontline staff will be able to monitor the effectiveness of your corrective actions if they can view the test results on a map and see for themselves what is happening within the plant’s environment. Visual imagery, after all, can be processed extremely quickly.
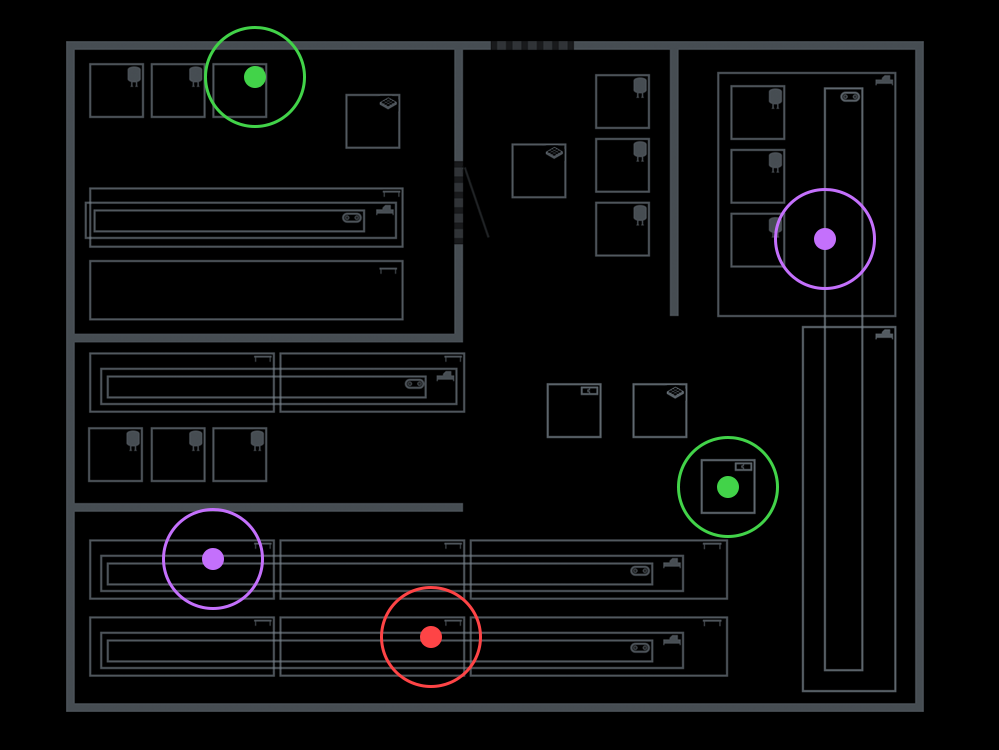
Take this map as an example. QA and sanitation teams can easily see that a particular strain of Listeria migrated from one location to another.
Sure, a QA professional could hand-draw those results, but mapping software makes the process far more efficient.
Curious to Learn More?
Environmental maps help connect the dots between testing results and tell a more holistic story about contamination incidents. With mapping software, QA teams like yours can save time by reducing the number of hours doing manual data entry and analysis. Moreover, they can gain real-time insights into what is happening in your plant. That way, you can increase confidence among sanitation teams that their actions are effective and among executives that contamination incidents will not affect your food products, causing expensive recalls down the line.
To learn more about Clear Safety’s mapping capabilities, download our product brochure or contact us.